
On Tuesday, most American ballots will offer a choice between two bundles. One leans toward regulation and redistribution, progressive cultural change, and international engagement. The other leans toward freer markets, traditional values, and national sovereignty. Those are rough summaries of the two parties' platforms, and they are also three of the four things the DNA Scan measures.
So we asked our own data a simple question: how many people actually hold one of those bundles?
What we counted
We took every US result from the current version of the DNA Scan: 2,640 people who took it between June 11 and October 29, 2026, counting each person once. Each Scan scores four axes from 0 to 100. For this count we used three of them, the ones the two platforms divide on most consistently: economics, culture, and nation versus world. A score counts as "left" or "right" when it falls more than five points from the midpoint.
29 in 100 matched the left bundle on all three. 18 in 100 matched the right bundle. The other 53 matched neither.
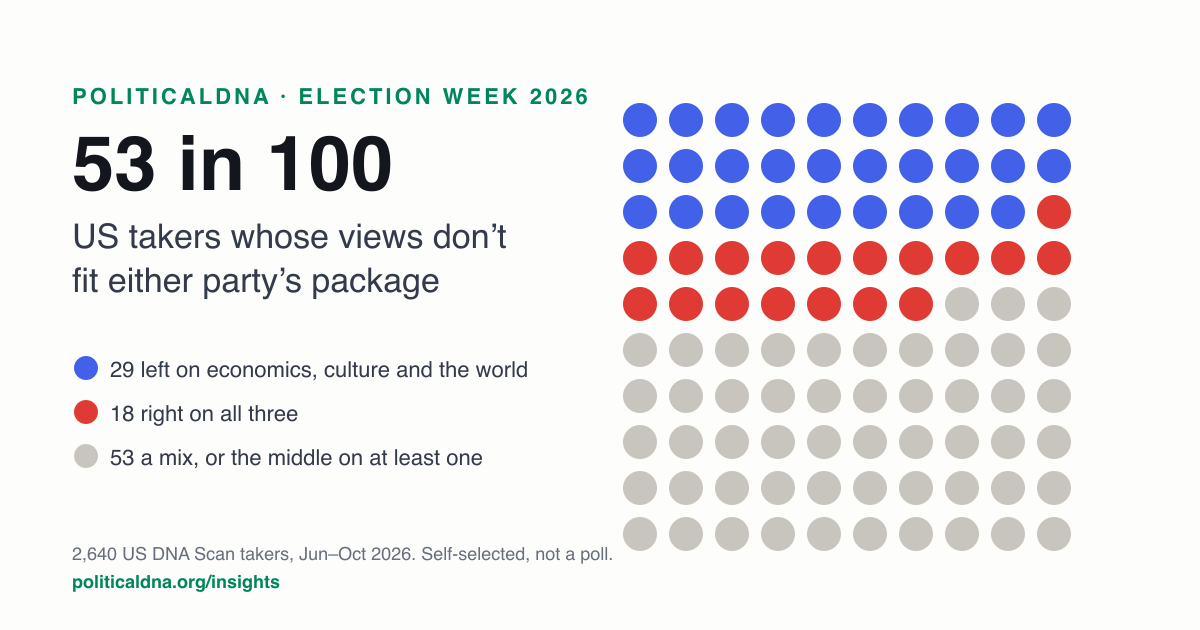
Who are the 53?
Not centrists. Only about 1 in 125 of our takers sat in the middle on all three questions. The rest lean one way or the other; their positions just don't line up into either package. The three most common combinations (all left on economics, which reflects our sample's lean):
- Left on economics, traditional on culture, national over global (6%). The largest mix by a nose, and a third the size of the entire right bundle.
- Left on economics and culture, in the middle on the world (6%). The left bundle, minus its internationalism.
- Left on economics, progressive on culture, national over global (6%). Progressive at home, wary of commitments abroad.
Here is the economics and culture picture on its own, split at the midpoint of each scale:
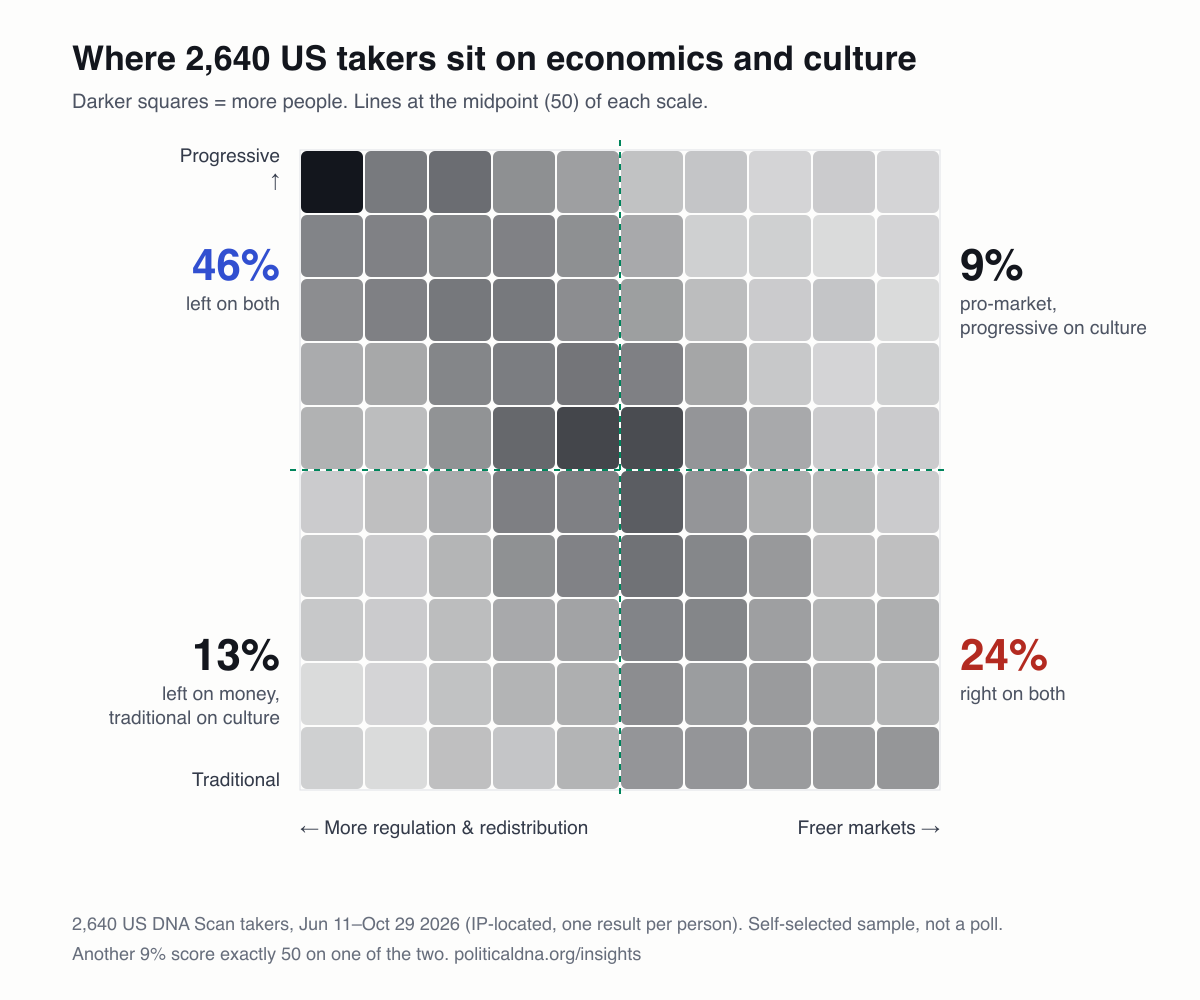
The bundles are held more strongly
There is a second pattern. People who match a bundle hold it firmly: on average their scores sit 27 to 29 points from the midpoint. The 53 sit about 14 points out, roughly half as far. Most people who fit neither package hold milder views, not contrarian ones.
But not all of them. About 1 in 11 of our takers holds strong views, more than fifteen points from the middle, that land on opposite sides. No line on Tuesday's ballot matches them.
Read this before you quote it
- This is not a poll. These are people who chose to take a political assessment online, not a random sample of voters. The numbers describe PoliticalDNA takers, not the electorate.
- Our takers lean left on average (a mean economic score of 42 and a mean cultural score of 56, where 50 is the midpoint). That is why the left bundle is bigger than the right. Don't read 29 versus 18 as a forecast.
- Where you draw "the middle" matters, but not to the conclusion. With no middle band at all, 44% match neither bundle. With a band ten points wide on each side, 66% do.
- "US" means IP-located. We place a result from the location of the device that finished the Scan. About one taker in five couldn't be placed and is left out.
The fourth axis, personal liberty versus community standards, isn't in the count because the two platforms don't divide cleanly on it. Adding it could only make the mixed group larger.
Which one are you?
The DNA Scan is a free four-minute assessment. It places you on all four axes and shows which of 32 political archetypes you sit closest to. Take the DNA Scan before Tuesday, and see whether you're in a bundle or one of the 53.